
Page 27 - Demo
P. 27
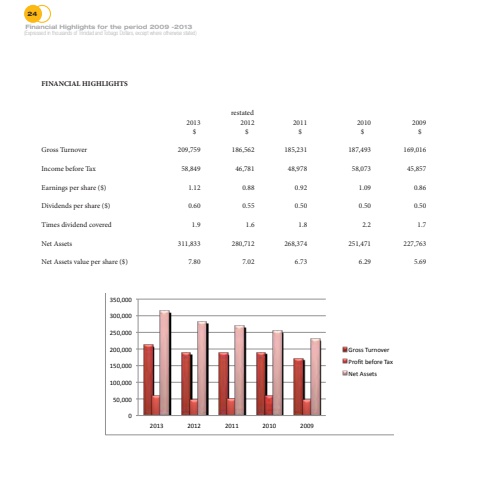
24 %u0015%u0001%u0019%u0015%u0014%u0015%u0015%u0015%u0001%u0016%u0015%u0015%u0014%u0015%u0015%u0015%u0001%u0016%u0019%u0015%u0014%u0015%u0015%u0015%u0001%u0017%u0015%u0015%u0014%u0015%u0015%u0015%u0001%u0017%u0019%u0015%u0014%u0015%u0015%u0015%u0001%u0018%u0015%u0015%u0014%u0015%u0015%u0015%u0001%u0018%u0019%u0015%u0014%u0015%u0015%u0015%u0001%u0017%u0015%u0016%u0018%u0001 %u0017%u0015%u0016%u0017%u0001 %u0017%u0015%u0016%u0016%u0001 %u0017%u0015%u0016%u0015%u0001 %u0017%u0015%u0015%u001a%u0001%u0003%u000e%u000f%u000f%u0001%u0006%u0011%u000e%u000c%u0012%u0009%u000e%u0001%u0005%u000e%u000b%u0010%u0001%u0008%u0009%u000e%u0009%u0001%u0006%u0007%u0013%u0001%u0004%u0009%u0010%u0001%u000f%u000f%u0009%u0010%u000f%u0001FINANCIAL HIGHLIGHTSrestated 2013 2012 2011 2010 2009$ $ $ $ $ Gross Turnover 209,759 186,562 185,231 187,493 169,016 Income before Tax 58,849 46,781 48,978 58,073 45,857 Earnings per share ($) 1.12 0.88 0.92 1.09 0.86 Dividends per share ($) 0.60 0.55 0.50 0.50 0.50 Times dividend covered 1.9 1.6 1.8 2.2 1.7 Net Assets 311,833 280,712 268,374 251,471 227,763 Net Assets value per share ($) 7.80 7.02 6.73 6.29 5.69Financial Highlights for the period 2009 -2013(Expressed in thousands of Trinidad and Tobago Dollars, except where otherwise stated)
